How to Measure Website Traffic Accurately: Step-by-Step Guide
Attracting more website traffic is the primary purpose of search engine optimization (SEO).
But after putting so much work into boosting your search engine rankings, how can you tell if it translates into more visitors? And how can you tell if your site lives up to those visitors’ expectations?
The answer lies in accurately tracking your traffic.
In this post, we’ll walk you through the process of measuring your website traffic with Google Analytics (GA4).
But first, let’s address why you should care about tracking your traffic in the first place.
The Importance of Analyzing Website Traffic
Keeping tabs on your website visitors is important for several reasons:
Understand Content Performance
Measuring your site traffic helps you identify which pages are a hit with users and which aren’t.
GA4 provides several engagement metrics that allow you to pinpoint parts of your site that may need content improvements.
At the same time, knowing which pages receive the most engagement from your visitors can inform what type of content you create in the future.
Optimize User Experience (UX)
Tracking website traffic helps you identify usability issues with your site.
For example, if GA4 reveals that users consistently use the search function to find certain pages, it could mean that those pages are hard to find using your navigation menu.
Likewise, if analytics show that a high proportion of users leave your site on a specific page, this could indicate that the content or layout of the page isn’t up to scratch. It might be that the page is too cluttered, slow to load, or simply doesn’t provide the information users are seeking.
Discover Where Your Traffic Comes From
Another critical aspect of traffic measurement is understanding the sources of your traffic.
GA4 breaks down traffic sources into categories such as organic search, direct, social media, referrals, and paid search.
These insights allow you to better evaluate the effectiveness of your various digital marketing activities and decide how to adjust your approach or reallocate your marketing budget accordingly.
Understanding Key Traffic Metrics
Before we address how to measure your traffic, it’s worth becoming familiar with the key traffic metrics you’ll find in GA4.
Here’s a breakdown of some of the most important metrics:
- Users: This is the number of distinct individuals who visited your site. “New users” are those who visited your site for the first time, while “returning users’ are those who also visited in the past.
- Sessions: This counts the number of distinct browsing sessions users had on your site. A session begins as soon as a visitor lands on your website and finishes after 30 minutes of inactivity.
- Pageviews: This is the number of times your pages were viewed, including repeated views by the same user during a single session.
- Engaged sessions: These are any sessions that last more than ten seconds, include a key event, or have two or more pageviews.
- Engagement rate: The percentage of engaged sessions on your site.
- Bounce rate: The percentage of non-engaged sessions on your site. A high bounce rate can be a sign that your site isn’t meeting user expectations.
- Average engagement time: This measures the average amount of time users spent focused on your site (i.e., not when your site is open in another tab or window that the user isn’t currently viewing).
- Key events: An action a user takes that is important to the business, such as form submissions, free-trial signups, or purchases. Key events used to be called “conversions” until recently.
- Entrances and exits: These tell you the number of sessions that started and ended on a specific page.
4 Steps for Measuring Website Traffic with Google Analytics
Now let’s look at how to track and analyze your traffic with GA4.
1. Set Up Your Google Analytics Account and Property
The first step is to create and configure your GA4 account.
To create an account, head to the Google Analytics website. Under “Admin,” click the “Create” button, then select “Account.”

Follow the prompts to set up your account and create a new property, providing details such as your website’s name, industry category, and reporting time zone.
Next, click “Add a data stream” followed by “Web” and enter your website’s URL. Then click “Create stream.” This step allows GA4 to start receiving data from your site.
After creating your data stream, Google will provide you with a “Measurement ID.” You’ll need to install the global site tag (gtag.js) containing this Measurement ID on every page of your site. You can do this by placing the tag in the HTML of your pages—ideally in the header section—or through a tag management system like Google Tag Manager.
Further reading: Check out Google’s documentation for more information about setting up analytics.
2. Complete Additional Data Configurations
Once you’ve set up data collection for your site, there are at least two extra data configurations you should complete to improve traffic measurement.
Set up key events
Setting up key events (conversions) will let you track user actions that matter most to your business. For example, downloads, video plays, form submissions, and transactions can all be tracked as events in GA4. Defining and measuring key events will give you valuable insights into how users interact with your site.
Connect to Google Search Console
Linking GA4 to Google Search Console will enhance your understanding of how organic search contributes to your site’s performance. For example, you’ll see where your site ranks, which keywords result in clicks to your site, and which landing pages drive most user engagement.
3. Analyze User Engagement and Traffic Sources
Now that your GA4 account is set up and ready to go, it’s time to dive into the data.
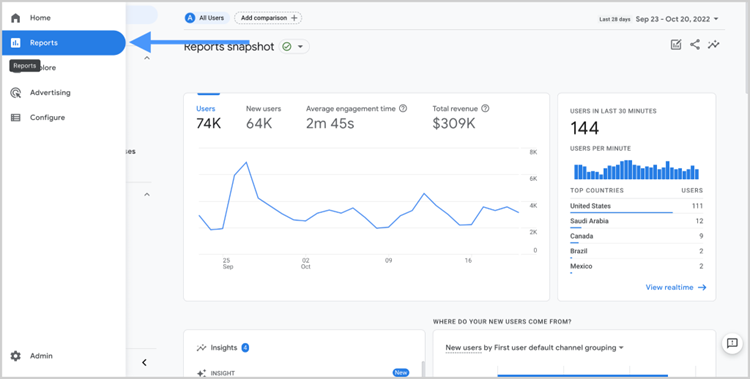
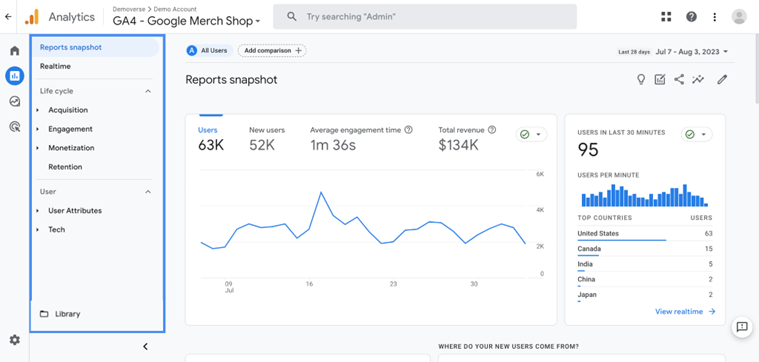
Google Analytics arranges your traffic data into various pre-made reports. These are available in the left-hand menu.

Reports include the Report snapshot and Realtime report, along with other specialized reports that help you understand different aspects of your site’s traffic and user behavior.

Here’s a breakdown of what each report offers:
- Report snapshot: This provides a quick glance at your key metrics such as user engagement, recent trends, and overall performance. It’s a great starting point for a high-level overview.
- Realtime report: This shows what’s happening on your site right now. It tracks active users and their actions, providing insights into the immediate impact of marketing campaigns or content changes.
- Life cycle reports: This collection of reports breaks down the user journey into acquisition, engagement, monetization, and retention.
- Acquisition overview report: This helps you understand how users find your site and whether your marketing efforts are successfully driving new visitors. It includes data on traffic sources, such as organic search, social media, referrals, and direct visits.
- Engagement overview report: This lets you analyze what users do once they arrive at your site. For example, you can compare engagement metrics, see which pages users visit, and understand which features they interact with.
- Monetization overview report: This helps you see which products users are buying, whether your promotions are attracting new visitors, and how much revenue you’ve generated.
- Retention overview report: This lets you see how well your site holds on to users, including data on return visits and engagement over time.
- User reports: This collection of reports give you a better understanding of who uses your website.
- User attributes overview report: This shows you the demographic breakdown of your users, including their location, gender, interests, age, and language.
- Tech overview report: This lets you see what technologies visitors use to access your site, such as browser, device type, and operating system.
Note: Initially, the only available report will be the “Realtime” report. Other reports will become available shortly after, once GA4 has collected enough data.
4. Use the Explorations Tool for Deeper Insights
Once you have a solid grasp of the standard reports, you can use GA4’s Explorations tool for more advanced analysis.
Explorations lets you create customized reports for more intricate comparisons and detailed breakdowns of your traffic data.
You can access this tool by clicking the “Explore” option in the left-hand menu of the Analytics dashboard.
Further reading: Check out Google’s in-depth documentation to learn more about Explorations.
Final Thoughts
Measuring website traffic is an essential part of effective digital marketing and website management.
By accurately tracking and analyzing your site’s traffic using a tool like GA4, you gain valuable insights into how visitors interact with your site, what drives their engagement, and how they convert into loyal customers.
Put simply, accurate traffic measurement is crucial for optimizing your marketing strategies, enhancing user experience, and ultimately driving business growth.
While the process of measuring basic traffic data with GA4 is fairly straightforward, advanced tracking and analysis techniques require more in-depth knowledge and a strategic approach. So if you’re looking for an agency that knows how to turn analytics insights into effective SEO campaigns, feel free to get in touch with HigherVisibility today.
